
Industrial Noise Monitoring: Techniques For Measuring Workplace Sound Levels

Measurement Instruments and Metrics for Industry Noise Monitoring
Measurement instruments vary by purpose: handheld sound level meters are often chosen for area surveys, while personal dosimeters are used to quantify individual exposures over time. Sound level meters commonly report LAeq, Lmax, and Lmin, and more advanced meters can log time-series data. Dosimeters typically compute a dose or time-weighted average based on configured exchange rates and criterion levels. Selection of the instrument may depend on the measurement duration, required metrics, and the need for spectral analysis. Practical considerations include battery life, data storage, and environmental protection for devices in harsh industrial settings.
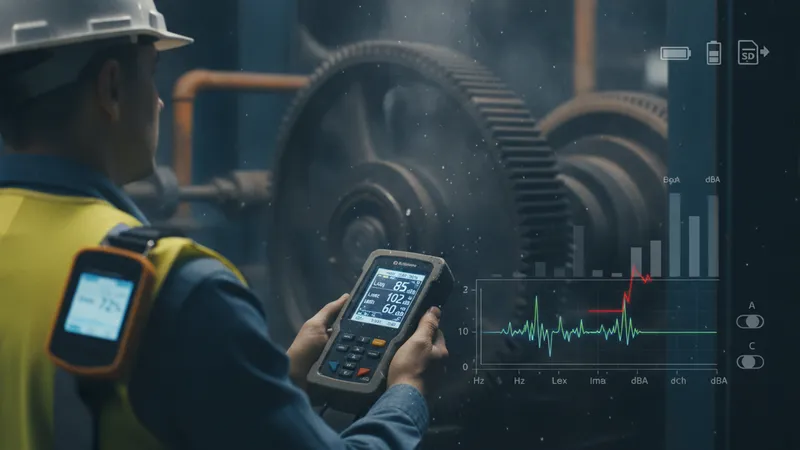
Acoustic metrics are selected to align with assessment aims. A-weighted decibels (dBA) are frequently used to approximate human hearing sensitivity for continuous noise, while C-weighting may be used for peak measurements or when lower-frequency energy is significant. Time-averaged metrics like LAeq express cumulative exposure over a defined period and can be converted to equivalent dose percentages when comparing against exposure criteria. Peak and impulse levels are important for sources that produce short-duration high-amplitude events; these may be reported alongside integrated metrics for a fuller characterization.
Instrument performance parameters—such as measurement range, frequency weighting options, time weighting settings, and dynamic range—can affect data quality. For tasks involving rapidly changing noise, fast time weighting or high sampling rates may better capture peaks and transient events. For steady-state machinery, slower integration may suffice. Users often document measurement settings and environmental conditions (temperature, wind) because these factors can influence readings and are important for interpreting results and establishing comparability between sessions.
Considerations for data handling include choosing formats for storage, ensuring timestamp synchronization, and maintaining consistent labeling of measurement locations and activities. Data export in standard formats enables post-processing and visualization. Where multiple instruments are deployed, inter-device consistency checks—such as side-by-side comparisons on a reference source—may help identify systematic differences and reduce uncertainty in comparative analyses. These practices support more robust interpretation of measured levels.